Costs for ARV Roadway (Preliminary)

A preliminary cost model has been developed for at-grade roadway suitable for a small Automated Road Vehicle (ARV), in particular the Automated Microbus. The model gives a total roadway cost of $1,100,000 per two-way mile (1.6 km).
The cost model, shown in the table below, uses data from a recently published report on bicycle path costs and benefits. It's assumed that a concrete bike path is also suitable for a small ARV. The Gross Vehicle Weight of an Automated Microbus is estimated to be 3,600 lbs (1640 kg). The bike path data includes unit costs for fencing, but other sources are used for guard rails and magnetic markers for the vehicle's control system.
The model in the bicycle path cost report is available online. It wasn't used directly, but its default values for pavement thickness and other parameters for a concrete, off-street bicycle trail were used in the ARV roadway model.
The $1.1M ARV roadway cost is an average value for the entire United States. The bicycle study also has a cost factor for each of the lower 48 U.S. states, as well as for a few U.S. metropolitan areas. They are on page 20 of the report. These factors range from 0.90 to 1.40, and they could be used to adjust ARV roadway cost for location.
Other ARV cost models will be added later for bridges, underpasses, stations, intersections, and vehicles.
Cost Per Mile (1.6 km) of Two-Way Automated Microbus Roadway in 2006 Dollars
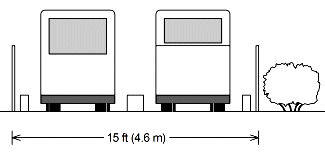
Total Roadway Width: 15 ft (4.6 m)
| Unit cost 2002 dollars |
Unit | Reference | Itemized cost | |
| Clearing and grubbing | 1703 | acre (43,560 sq ft) | 1 | 3,096 |
| Excavation, 6" | 15 | cu yd | 1 | 22,000 |
| Subtotal earthwork | 25,096 | |||
| Earthwork Contingency | 10% | 1 | 2,510 | |
| Total earthwork | 27,606 | |||
| Base, 4" aggregate | 28 | cu yd | 1 | 27,378 |
| Pavement, 5" Portland Cement Concrete | 142 | cu yd | 1 | 173,556 |
| Center divider, 12" x 12" Portland Cement Concrete | 142 | cu yd | 1 | 27,769 |
| Subtotal construction including earthwork | 256,308 | |||
| Construction Contingency | 10% | 1 | 25,631 | |
| Total Construction | 281,939 | |||
| Fencing, both sides | 67,000 | mile, one side | 1 | 134,000 |
| Outer guard rail, both sides | 12.18 | ft, one side | 2 | 128,621 |
| Magnetic markers | 10,000 | lane mile | 3 | 20,000 |
| Subtotal: Constr, Fence, Gd Rls, Mag Markers | 564,560 | |||
| Admin/Planning/Design/Inspection | 20% | 1 | 112,912 | |
| Subtotal: Project w/o contingency | 677,472 | |||
| Project contingency | 20% | 1 | 135,494 | |
| Total project, 2002 dollars | 812,966 | |||
| Inflation factor 2002 to 2006: PPI Highway and Street Construction, extrapolated | 1.404 | 4 | ||
| Total project, 2006 dollars, rounded to two significant figures | 1,100,000 | |||
References:
1. "Guidelines for Analysis of Investments in Bicycle Facilities", NCHRP Project 7-14, Final Report, August 2005, pp. 11-32. This is an extremely detailed and comprehensive study that was used as the basis for most unit costs and contingency factors. To be conservative, fence costs were taken unchanged from the report, even though the report assumed a 6 ft (1.8 m) fence, while the Microbus fence would be about 4 ft (1.2 m) high. The Project Contingency value of 20% was based on the analysis on page 31 of the report, although other values could also be justified.
2. "The Safety and Cost-Effectiveness of Bridge-Approach Guardrail for County State-Aid (CSAH) Bridges in Minnesota", October 2005, p. 51. A unit cost range of $12-$15/ft in 2004 dollars is listed. The midpoint of the range was used, and the value was converted to 2002 dollars using the Producer Price Index for Highway and Street Construction (see Reference 4, below). To be conservative, the nationwide guardrail cost was not adjusted downward to reflect higher costs in Minnesota. A standard guardrail is assumed even though the Automated Microbus would be much lighter and slower than many vehicles on conventional highways, and it may be possible to get by with a less expensive guardrail. However, conventional guardrails are produced in large quantities which holds down the cost. To be conservative, no savings over conventional guardrails are assumed.
3. Yin, Y, M. A. Miller, and S. E. Shladover, "Assessment of the Applicability of Cooperative Vehicle-Highway Automation Systems to Freight Movement in Chicago", Transportation Research Board 2004 Annual Meeting CD-ROM, p. 14. The paper lists a cost of $10,000 per lane mile to install magnets in existing pavement, and $5,000 per lane mile for new construction. However, experience to date mostly involves existing construction. To be conservative, possible savings from installing magnets in new construction were ignored, and the $10,000 per lane mile figure was used. No attempt was made to adjust this number for inflation before combining it with other costs in 2002 dollars.
4. Bureau of Labor Statistics, Producer Price Index for Highway and Street Construction. The Series ID is the following 15-character string: PCUBHWY--BHWY--. The annual values used were 133.7 (2002), 148.2 (2004), and 166.8 (2005). Costs were first brought forward to 2005 by multiplying by (166.8/133.7). It was then assumed that costs would increase from 2005 to 2006 by the same percentage as from 2004 to 2005. Considering the sharp increase in costs in the last year or two, this seemed more accurate than extrapolating a longer time series. The total adjustment from 2002 to 2006 was (166.8/133.7)*(166.8/148.2) = 1.404.